
Step 1: Collect ground samples
To extract useful information from satellite images about land features, we generally need to gather some information on the ground, commonly referred to as ground, reference, or field data. These data or samples provide information to verify what the satellite sensors detect. They should be collected close in time to when the satellite images are acquired.
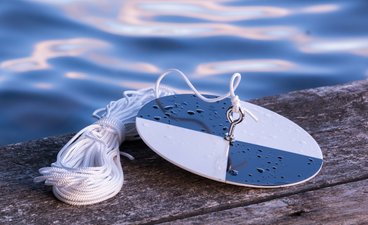
Several ways can be used to gather ground samples depending on the water quality property being studied. For lake water clarity, we use Secchi depth data from the Minnesota Pollution Control Agency and its Citizen Lake Monitoring Program, which regularly measures Secchi depth on about 900 lakes in Minnesota.
Step 2: Acquire satellite imagery
Satellite sensors vary in their spatial, spectral, radiometric, and temporal resolutions. Spatial resolution can vary from 0.6 meters (m) (e.g., QuickBird) to 1,000 m (MODIS). The Landsat sensors used for lake water clarity work, have medium resolution (30 meters), but cover large areas with a swath width of 115 miles. MODIS, the sensor on the Terra and Aqua satellites, covers a much larger area with 1,400 miles swath width, but at coarse resolution (250-1000 m). Obtaining clear imagery is critical because haze, as well as clouds, can affect the results. If you would like to learn more about the science and technology behind satellite remote sensing, visit the Classroom (PDF) section.
Step 3: Process satellite imagery
Once imagery is acquired, a series of steps are taken to prepare the imagery for analysis.
1. Following geometric rectification to match other maps, the areas with clouds and haze are clipped. Rectified data have been provided by EROS for several years, eliminating finding ground control points from our processing.
2. When mapping water features, non-water areas, such as agricultural land, urban land, and forests, are masked from images.
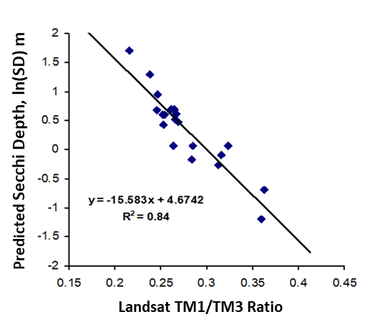
3. After imagery has been pre-processed, the relationships between lake clarity and their spectral-radiometric responses (in the simplest sense, colors) are determined by regression modeling for a representative sample of each water quality variable.
It is important to note that in our original approach, we calibrated each image to ground-based data. This approach eliminated the need to correct imagery for atmospheric effects (differing levels of aerosols and other factors that affect the amount of light reflected from ground/lake surfaces that reach the satellite sensor). In our more recent studies, we have used atmospherically corrected imagery, which enables the use of calibration data across multiple images.
4. The regression model then is applied to all lakes in the image, providing a census of lake clarity.
Step 4: Create a map
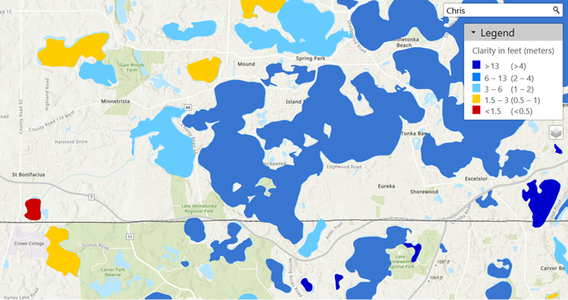
Once the mathematical relationship between the satellite data and the field data has been developed and applied to all pixels, a map of water clarity is produced, and the pixels are grouped into discrete classes of clarity level and visually displayed, such as in the Lake Browser, or put into a Geographic Information System (GIS) for further analysis.
Similar relationships can be developed between reflectance data in various sensor bands and other important measures of water quality, including chlorophyll, a measure of the abundance of algae in waterbodies; colored dissolved organic matter (CDOM), a measure of dissolved organic carbon that is visibly colored and affects many aquatic ecosystem processes; phycocyanin, a measure of cyanobacteria (blue-green algae); and various measures of suspended particulate matter in natural waters. Compared with earlier Landsat satellites, the sensors on newer satellites, such as Landsat 8 and the European Sentinel-2 better facilitate the measurement of these properties.