
Phycobilins are photosynthetic pigments unique to cyanobacteria (also referred to as blue-green algae) and Rhodophyta, or red algae. A class of phycobilin pigments known as phycocyanin is unique to cyanobacteria. Measurement of phycocyanin concentrations thus may be a way to estimate the biomass of cyanobacteria in freshwaters. Phycocyanin may be measured by physical-chemical methods similar to those for chlorophyll a determination, e.g., solvent extraction, chromatographic separations, and spectrophotometric analyses.
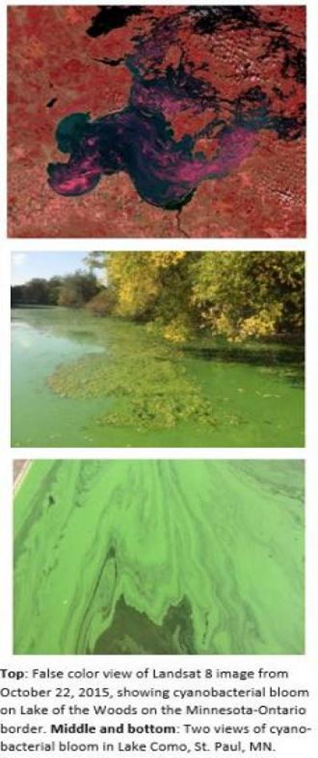
Remote sensing measurement of phycocyanin is much less common than that for chlorophyll a, but interest in it as a means of measuring the abundance of cyanobacteria or predicting the onset of harmful cyanobacterial blooms has grown substantially over the past ~15 years. Most operational satellites do not have sensor bands that uniquely identify phycocyanin’s reflectance spectrum. Eurosat’s Sentinel-3 has a band in the range of 600-630 nm, where phycocyanin has a characteristic absorption peak, as did the earlier MERIS satellite (no longer operational). This band was used in algorithms by Randolph et al. (2008) and Schalles and Yacobi (2000) to retrieve phycocyanin data from satellite imagery. Accurate algorithms using this band require rigorous atmospheric corrections, however (Stumpf et al. 2016), and more recent studies (e.g., Mishra et al. 2019) have criticized the reliability of algorithms using this band to estimate cyanobacterial biomass reliably. The difficulty in estimating cyanobacterial biomass from phycocyanin accurately arises in part from the tendency of the organisms to grow in clumps that often form “scum” layers of various thickness and patchiness in surface waters (e.g., see pictures at right).
A more recent approach to estimate cyanobacterial abundance directly (without explicitly measuring phycocyanin) uses the effects of phycocyanin on the shapes of reflectance spectra (Mishra et al. 2019). The complicated algorithm for this approach relies on the fact that chlorophyll a fluoresces strongly at 681 nm (just above the primary absorption peak of chlorophyll a), leading to increased apparent reflectance that counteracts the effects of chlorophyll absorption. However, chlorophyll in cyanobacteria fluoresces much more weakly. The presence and abundance of cyanobacteria in waters thus are evaluated from changes in a “spectral shape index,” SSI (Mishra et al. 2019). A cyanobacteria assessment network (CyAN) recently was developed by a consortium of federal agencies (U.S. EPA, NASA, NOAA, USGS) that uses the above approach as an “early warning system” to detect/predict the occurrence of harmful (cyanobacterial) algal blooms in U.S. surface waters.
An important limitation to applying satellite imagery to measure phycocyanin and cyanobacterial distributions in Minnesota lakes is the lack of ground-based calibration data on phycocyanin concentrations in lakes. The spatial resolution of the Sentinel-3 sensor (300 m) limits its use to relatively large lakes (> ~400 acres). Although this includes only about 8% of Minnesota’s lakes, 900 of the state’s most recreationally important lakes are large enough to be measured by this satellite.