
Our more recent image processing procedures to retrieve water quality data for Minnesota lakes build on our earlier methods, described on the Past Methods page, with four important updates that take advantage of the improved sensor systems and advancements in image analysis and modeling, and computer processing capabilities.
1. Our earlier procedures essentially used raw imagery, i.e., uncalibrated radiance values measured by satellite sensors. This meant that each image needed to be validated with ground-based data to account for differences in atmospheric conditions that affect the intensity of surface reflectance received by satellite sensors. We now use imagery atmospherically corrected to yield surface reflectance (Rrs) data, using a modified atmospheric correction for inland waters (MAIN) (Page et al. 2019).
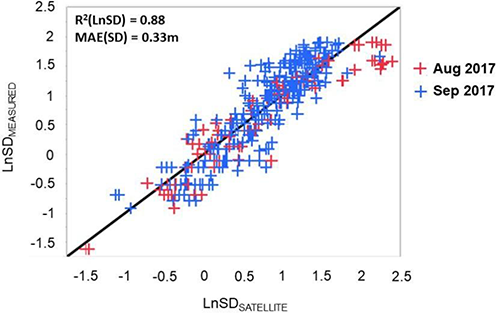
2. The use of atmospherically corrected (Rrs) imagery allows us to process multiple images using algorithms developed with in situ data for a given water quality parameter that can be applied to new imagery. The figure at the right illustrates how atmospherically corrected images acquired a month apart fit a single water clarity (SD) model. In turn, this model then can be applied to other images that have undergone the same atmospheric correction. The image manipulations are done on high-performance computers by the Minnesota Super Computing Institute.
3. With the availability of imagery from the two European Sentinel-2 satellites, which have more spectral bands than Landsat satellites, we now are able to accurately retrieve a broader array of water quality data, including water clarity (SD), chlorophyll, CDOM, total and volatile suspended solids, and turbidity.
4. With the more frequent acquisition of imagery by the constellation of Landsat 8 and 9 and two Sentinel-2 satellites, we have a much greater likelihood of acquiring cloud-free images and capturing data associated with a given event or time. We also are able to mosaic a sequence of images to visualize how specific water quality conditions change over time in a lake or group of lakes. Examples of this capability can be found for turbidity in western Lake Superior on the Turbidity and Suspended Matter page and for chlorophyll changes in lakes of the western Twin Cities metro area over a summer season on the Chlorophyll page.